
Performance Tables
2023-2024
All primary schools in the country are required to publish their data from any statutory assessments taken by our children. We are incredibly proud of how well our children achieve and our results are consistently above local and national averages. However, statutory assessments are only one small part of the broad and balanced curriculum that we offer to our children.
Statutory assessment happens at the following points in our children’s learning journey:
- At the end of Reception against the Early Learning Goals
- Year 1 phonics screening
- Year 4 multiplication times table check (MTC)
- At the end of Key Stage 2 in Reading, Writing and Maths
Our publicly published data can be found here: https://www.gov.uk/school-performance-tables
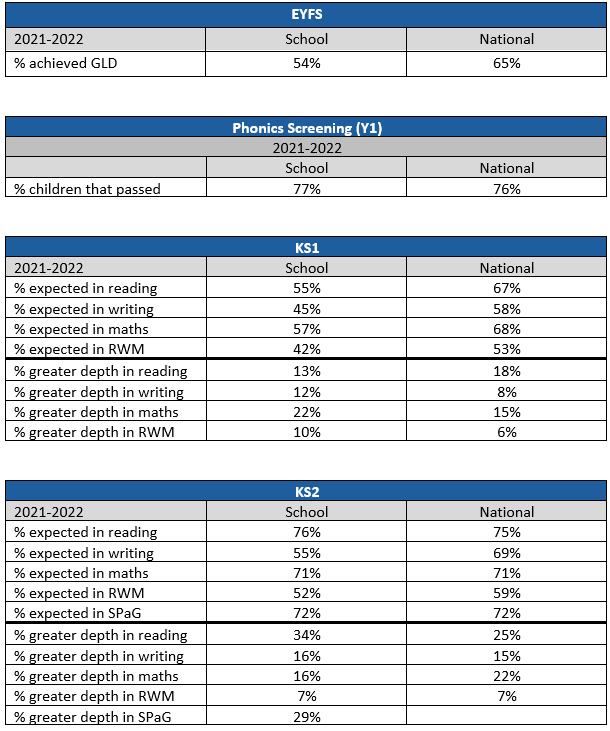
EYFS: Children are defined as having reached a Good Level of Development (GLD) at the end of EYFS if they have achieved at least the expected level for the ELGs in the prime areas of learning and the specific areas of mathematics and literacy. This helps teachers and parents to understand broadly what a child can do in relation to national expectations.
|
|
Kerr Mackie Primary School |
National |
|
Good Level of Development |
69% |
67% |
Phonics Screening Check (PSC): The phonics screening check is a quick and easy check of your child's phonics knowledge. It helps the school confirm whether your child has made the expected progress and helps us to identify whether your child needs additional support at this stage in developing their early reading skills. The phonics screening check contains 40 words divided into two sections of 20 words. Both sections contain a mixture of real words and pseudo-words. Pseudo-words are words that are phonically decodable but are not actual words with an associated meaning. Pseudo-words are included in the check specifically to assess whether your child can decode a word using their phonics skills.
|
|
Kerr Mackie Primary School |
National |
|
Phonics screening check |
79% |
75% |
Multiplication Times table Check (MTC): The multiplication times table check (also known as an MTC) is a statutory assessment given to Year 4 pupils in England to assess their ability to fluently recall their multiplication tables up to 12x12, essentially testing how well they know their times tables. It's an online test with 25 questions where students have 6 seconds to answer each one, helping schools identify children who may need additional support in this area.
|
|
Kerr Mackie Primary School |
National |
|
Multiplication Times Table Check Average Mark out of 25 |
21 |
20 |
End of Key Stage 2: If you have a child in year 6, at the end of key stage 2 (KS2), they will take national curriculum assessments in English grammar, punctuation and spelling, English reading and mathematics. The tests help measure the progress pupils have made, and identify if they need additional support in a certain area. The tests are also used to assess schools’ performance and to produce national performance data. As there is no test for English writing, this will be reported as a teacher assessment judgement. This is a judgement teachers will make, based on your child’s work at the end of KS2. You will also receive a teacher assessment judgement for science.
Below is a table that shows the percentage of pupils who achieved working at the expected standard for Reading, Writing, Maths and all three combined, against the National percentage for England and Wales.
|
End of Key Stage 2 achieving the expected standard |
Kerr Mackie Primary School |
National |
|
Reading |
85% |
74% |
|
Writing |
77% |
72% |
|
Maths |
80% |
73% |
|
Combined |
64% |
61% |
Below is a table that shows the percentage of pupils who were working at the greater depth standard for Reading, Writing, Maths and all three combined, against the National percentage for England and Wales.
|
End of Key Stage 2 achieving greater depth |
Kerr Mackie Primary School |
National |
|
Reading |
38% |
28% |
|
Writing |
22% |
13% |
|
Maths |
33% |
24% |
|
Combined |
20% |
8% |
Key Stage 2 Scaled Scores 2023 - 2024
Another way of showing Key Stage 2 results is a scaled score. The raw score (the actual number of marks a child scores) will be translated into a scaled score. The questions in the test paper are different every year, so the level of difficulty may slightly vary from year to year. For this reason, raw scores are converted into scaled scores to ensure accurate comparisons of pupil performance over time.
A scaled score of 100 or more means a child is working at the expected standard, while a score below 100 indicates that a child hasn’t reached the government expected standard. The maximum score possible is 120 and the minimum is 80. To meet government expectations, pupils must achieve 100 in their scaled scores. However, this equates to different marks for each paper and can change each year.
|
Scaled Score to achieve Working at the expected standard |
Average Scaled Scores from Kerr Mackie Primary School |
|
|
Reading |
100 |
106 |
|
Maths |
100 |
106 |
|
Spelling, punctuation and grammar |
100 |
108 |
Key Stage 2 Progress Measures
Progress measures will not be published for the 2023/24 and 2024/25 academic years as KS2 pupils in these years did not have KS1 assessments due to the COVID-19 pandemic.
2021-2022
Please see the link below to check school performance tables:
https://www.gov.uk/school-performance-tables